The DeFi Collective - First Year Financial Report(Oct2023 - Oct2024)
 TokenBrice
- October 17, 2024

The Collective has been profitable and operating fully onchain since its inception: good for the Ants, as it streamlines the accounting process. While the Collective is a non-profit Swiss-based association, it has revenues and expenses, as a regular business would. Since the treasury is one of the main sources of impact it has to support the most resilient DeFi protocols, expenses are kept in check and revenues maximized, as much as possible while remaining mission-aligned, to generate a surplus (more on this below).
This post provides an overview of the treasury activity and results obtained in the first year of operations of the DeFi Collective.
Yearly Financial Overview
Let’s start directly with the main figures of interest:
- Year 1 Total Revenues: $575,433.09
- - Year 1 Total Expenses: $127,480.85
- = Year 1 Total Earnings: $447,952.14
- ⇒ Year 1 Surplus: 77.85% (monthly average = 78.52%)
The table below provides a month-by-month overview of the Collectives’ financial position as it evolves over the year:
| MONTH | Lock Value | L2 Revenues | L1 Revenues | Tot. Expenses | Earnings | Surplus |
| Oct 23 | $342,501.00 | $17,256.53 | -$9,583.00 | $300.07 | $7,373.46 | 96.09% |
| Nov 23 | $576,021.27 | $25,326.21 | $7,642.55 | $11,887.58 | $21,081.18 | 63.94% |
| Dec 23 | $930,293.46 | $24,276.59 | $11,289.36 | $4,924.91 | $30,641.04 | 86.15% |
| Jan 24 | $650,764.12 | $38,751.74 | $10,442.87 | $6,248.75 | $42,945.86 | 87.30% |
| Feb 24 | $900,317.74 | $33,115.16 | $4,426.38 | $11,104.96 | $26,436.58 | 70.42% |
| March 24 | $3,138,105.08 | $64,710.09 | $21,977.86 | $24,859.42 | $61,828.53 | 71.32% |
| April 24 | $1,787,778.17 | $72,358.73 | -$23,550.04 | $9,740.64 | $39,068.05 | 80.04% |
| May 24 | $1,823,285.43 | $51,660.88 | $5,722.42 | $15,910.56 | $41,472.74 | 72.27% |
| June 24 | $961,710.18 | $41,290.38 | $0.00 | $10,760.05 | $30,530.33 | 73.94% |
| July 24 | $923,006.72 | $39,663.50 | $19,242.47 | $10,031.72 | $48,874.25 | 82.97% |
| Aug 24 | $990,959.85 | $24,483.28 | $54,113.50 | $10,134.28 | $68,462.50 | 87.11% |
| Sept 2024 | $1,176,093.64 | $31,369.78 | $9,445.85 | $11,578.01 | $29,237.62 | 71.63% |
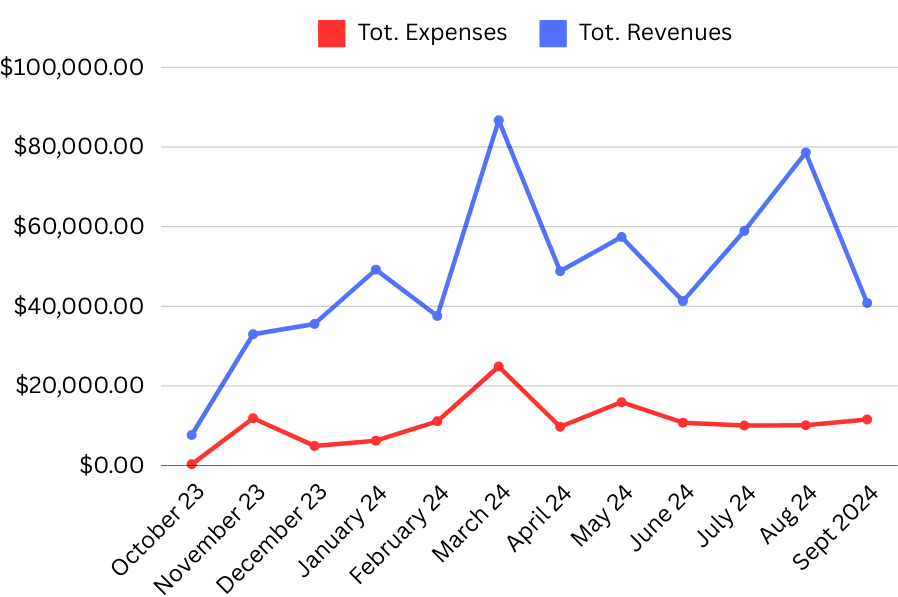
The Collective has been a profitable association since day one, with total revenues rapidly ramping up in the first few months as capital was being deployed, and securing a minimal $40k monthly baseline since March 2024.
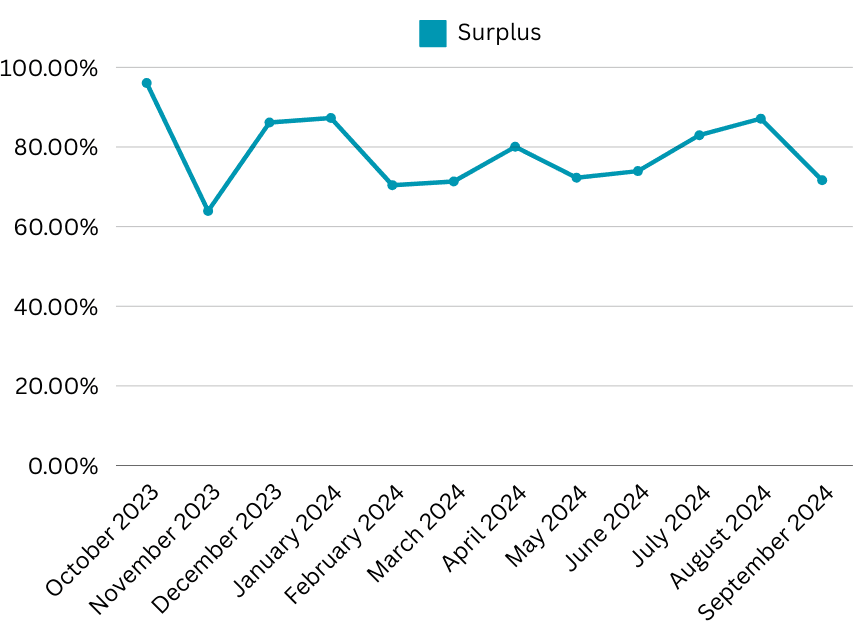
Meanwhile, with expenses kept in check, the monthly surplus that enables the treasury to grow and further extend the support provided to genuine DeFi protocols has been a top priority. It has maintained over 70% during the whole year, apart from November 2023 when exceptional expenses related to the Collective legal setup were due.
Where does the yield come from?
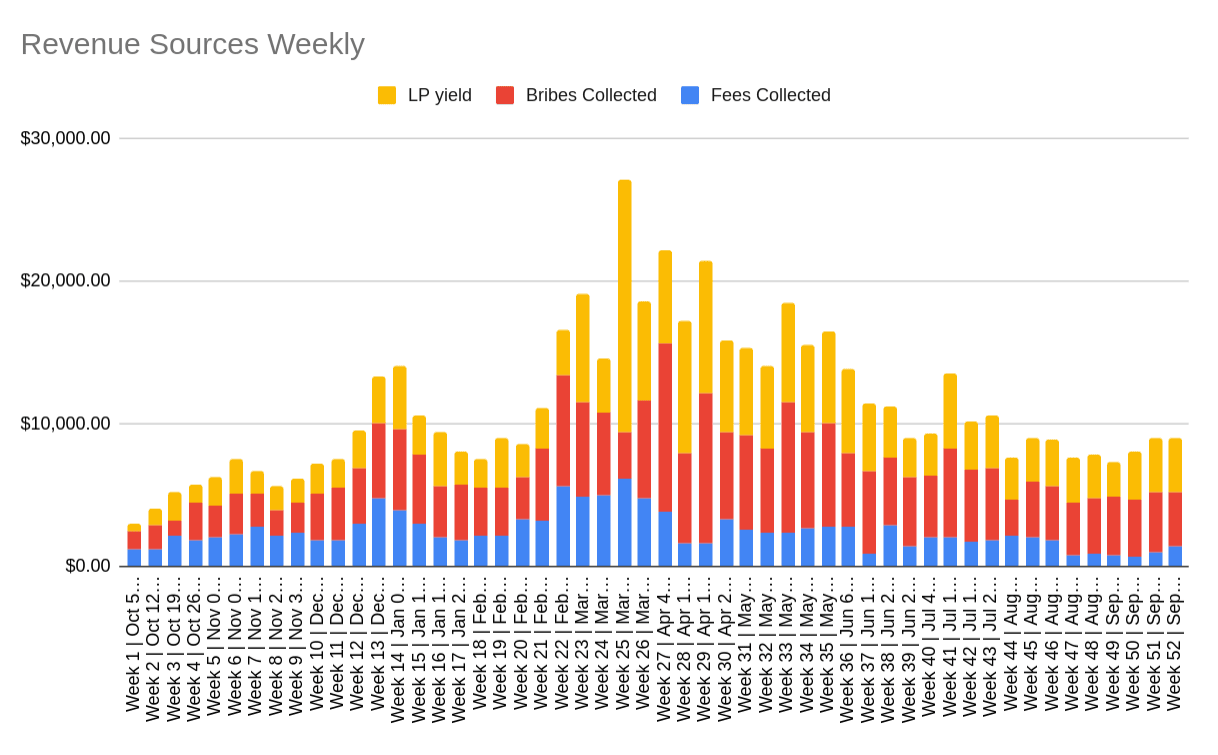
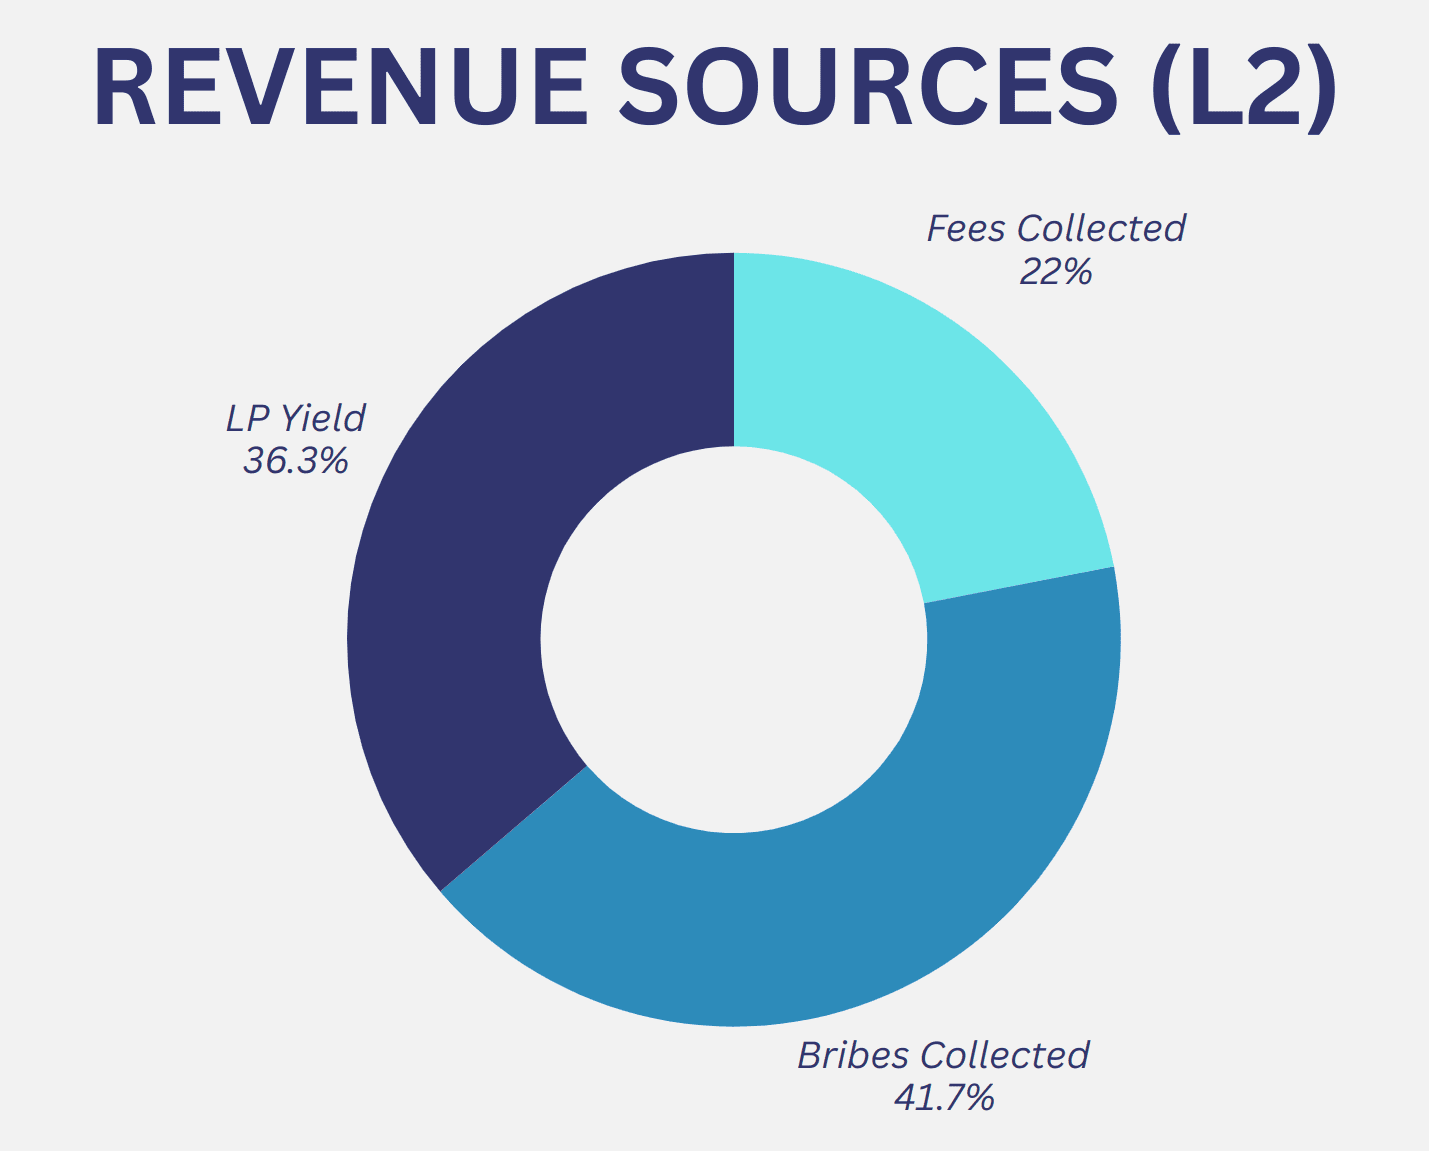
Just like with a DeFi protocol, this is a reasonable question to ask. The Collective has three main sources of income. The first two are derived from its liquidity-driving positions, such as veAERO and veVELO:
- Fees Collected: earned by voting on pools with the liquidity-driving positions
- Bribes Collected: earned while voting on pools that are bribed
- LP Yield: earned thanks to the Collective own liquidity providing positions supplied on various DEXes
Note – Donations/Grants: the Collective sometimes receives grants or donations from other protocols or teams. Considering the sporadic and unpredictable nature, grants/donations are not included in the revenues and earnings figures. Assets appreciation/depreciation are also not included.
The distribution of the total income between the three sources varies week by week, the chart below explains how revenues obtained on L2 evolved throughout the year:
To provide a better understanding of the distribution between the three L2 revenue sources, we also mapped the overall distribution:
Expenses
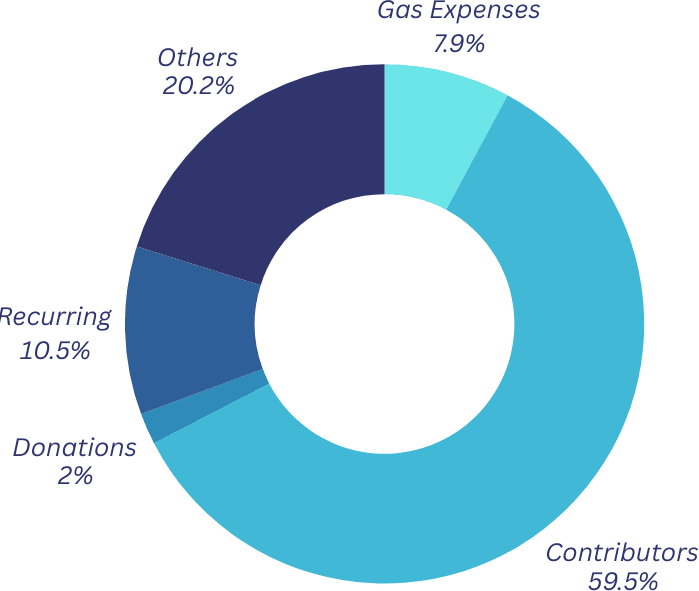
By far, the main expense of the Collective is the contributors compensation, with a total of 6 contributors now being employed. The second post of expenses is what we categorize as “Other”, which this year included expenses incurred while setting up the association, a graphic design contract for the website and brand identity, and during our first retreat at ETHBelgrade. Following suit are the recurring expenses, which includes fees for the software used, accounting services and office address. Since the Collective operates fully onchain, gas-related expenses are no small matter, although the impact of Dencun has been clearly felt, more on this later: slightly over $10k was spent as gas during this first year. Finally, the Collective also occasionally donates to other like-minded initiatives or individuals, making for the last expense category.
| MONTH | Gas Costs | Contributors | Donations | Recurring | Other |
| October 23 | $252.63 | $0.00 | $47.44 | ||
| November 23 | $1,693.32 | $4,000.00 | $500.00 | $439.70 | $5,254.56 |
| December 23 | $460.43 | $4,000.00 | $464.48 | ||
| January 24 | $284.27 | $5,500.00 | $464.48 | ||
| February 24 | $3,148.35 | $5,500.00 | $1,000.00 | $1,456.61 | |
| March 24 | $1,696.81 | $5,500.00 | $0.00 | $1,456.61 | $16,206.00 |
| April 24 | $1,282.64 | $7,000.00 | $0.00 | $1,458.00 | |
| May 24 | $150.50 | $8,900.00 | $1,000.00 | $1,599.61 | $4,260.45 |
| June 24 | $812.99 | $8,500.00 | $0.00 | $1,447.06 | |
| July 24 | $29.53 | $8,500.00 | $0.00 | $1,502.19 | |
| Aug 24 | $132.09 | $8,500.00 | $0.00 | $1,502.19 | |
| Sept 2024 | $74.37 | $10,000.00 | $0.00 | $1,503.64 |
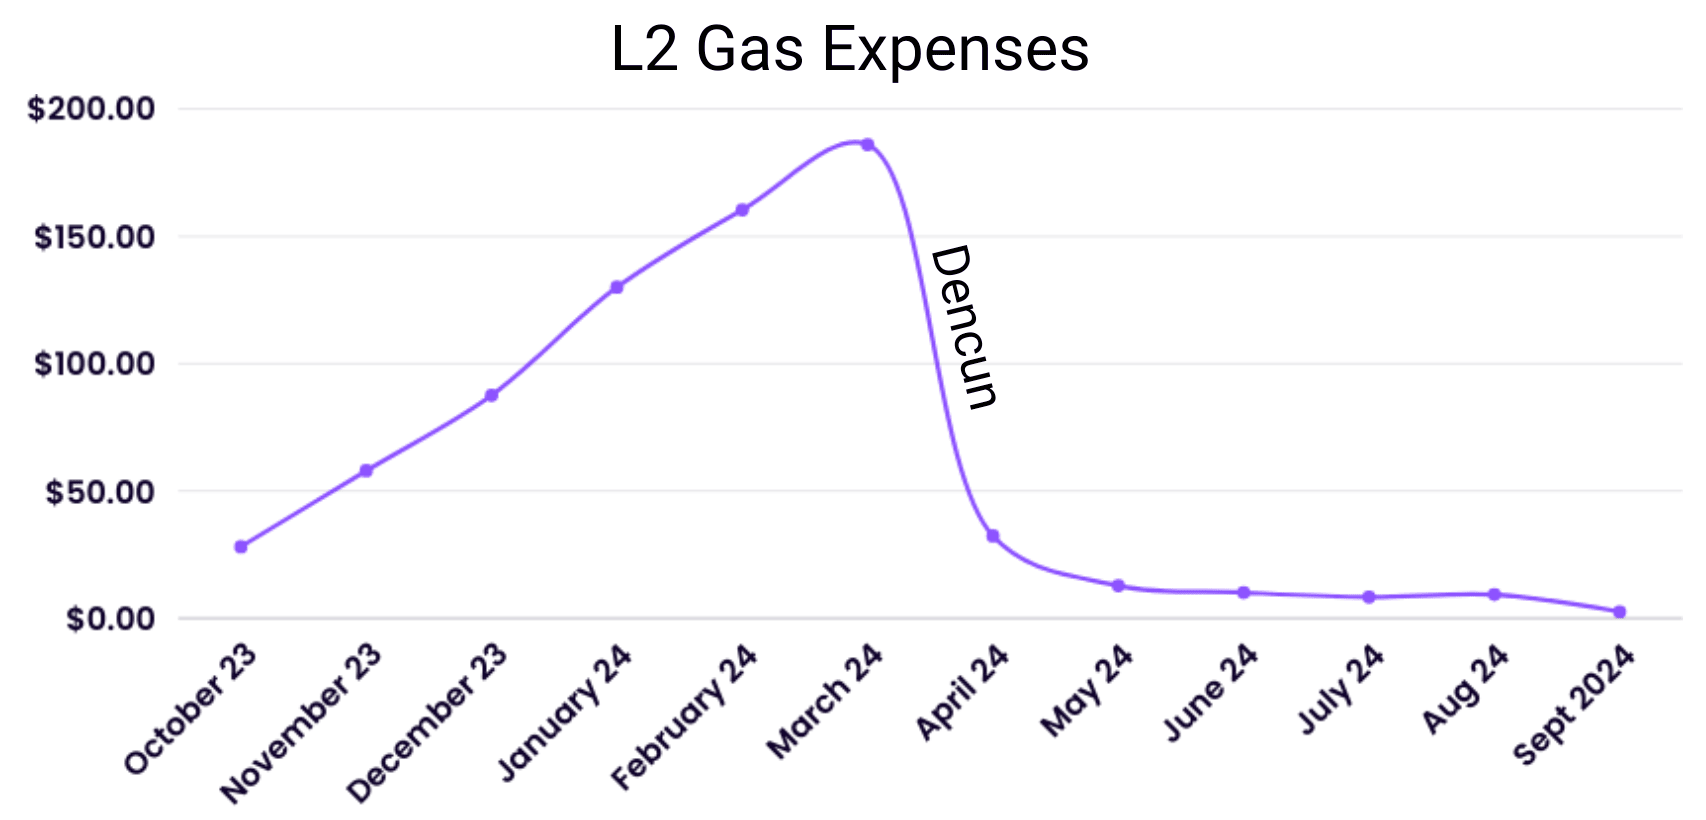
Despite a high volume of transactions executed weekly, the gas costs incurred on Layer 2 plummeted thanks to Dencun:
| Chain | Nounce (Oct 03 2024) | Average TX/week |
| Optimism | 542 | 10.42 |
| Arbitrum | 463 | 8.9 |
| Base | 318 | 6.11 |
| Mantle | 226 | 4.34 |
| Polygon-PoS | 205 | 3.94 |
| Linea | 151 | 2.90 |
To note: deficollective.eth is a Gnosis Safe, and transactions are batched as as much as possible; thus an increment of 1 of the nounce (1 transaction) often covers more than one operation, sometimes dozens at once.
Liquidity-Driving Capabilities Overview
Through the year, the Collective expanded its L2 presence from Optimism+Base+Arbitrum to include Polygon-PoS, Mantle, and Linea, before re-centering it on… Optimism+Base+Arbitrum: there is a lesson there: getting the Ants to set up the colony on a new L2 is now much more demanding.
In terms of liquidity-driving capabilities, the Collective’s big success for the year is the strategic growth of the veAERO position, which nicely coincided with the explosive growth of Aerodrome. Starting with 122,430 veAERO (face value then $2,693.00) in October, we closed the year with 413,120.63 veAERO (face value $439,690.95)
Weekly locks feed into the veVELO position, enabling it to grow from an initial of 5,625,930 veVELO (face value then $207,945) to 6,112,669.96 veVELO (face value of $581,129.94).
As we say in French, “you can’t make an omelette without breaking some eggs”, and some eggs were indeed broken when it comes to attempting to grow strategic liquidity driving positions:
- With Retro being quasi-dead, the Collective’s 812k veRETRO are not useful anymore (obtained initially through a donation)
- With Blueprint being shortlived, a similar situation is observed with the Collective’s 1.3M veBLUE position (also obtained through a donation)
- While Ramses is still alive and strong, misalignment with the team looking to maximize bribes before long-term impact forced us to return the initial position of 3.5M veRAM in June, which sizably impacted our position growth.
- Finally, the Collective separated with its ~80k vlAURA position, probably a bit too late, as Balancer/Aura is not able to retain traction and produce meaningful impact.
Liquid Assets Overview
While the Collective deploys assets in various types of liquidity pools, including volatile pools such as LUSD/POOL on Aerodrome or POOL/ETH on Ramses, we closely monitor the “pure exposure”, aka ETH and stablecoins that are deployed either in correlated liquidity pools, in single staked options or used as collateral (responsibly, per the Treasury Management Policy).
- Starting with initially 50 ETH, the Collective now controls >155 ETH.
- Starting with $330k stablecoins exposure, the Collective now controls >$400k (+$127k expenses during the year).
These reserves are critical, as they enable the Collective to both fulfill its obligations, but also grow a war chest enabling it to survive and thrive even in the unlikely scenario where the revenues were to plummet to 0. With the current pace of spending, the Collective can survive more than three years without any income.
Conclusion
We hope this report will help its readers understand the treasury activities conducted by the DeFi Collective. For more granular information, please refer to the monthly treasury reports and quarterly summaries.


